How are our mobility needs changing?
Our transport and mobility needs are growing faster than the population, both for rail and road. The transport sector now accounts for 36% of our final energy consumption, up from 32% in 1990.
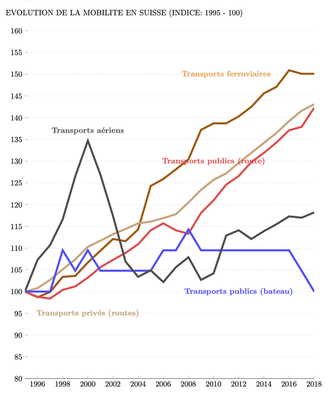
Between 2000 and 2018, Switzerland's population grew by almost 20%. During this period, the number of kilometres travelled increased at a much higher rate [→ see figure below]: + 62% for rail and + 29% for road for passenger transport. Only rail freight transport has fallen sharply since 2004, returning to its 1995 level. The contribution of transit traffic to this general trend is also significant (mainly vehicles crossing Switzerland along the north-south axis).
Despite this sharp increase in demand for mobility and transport, the final energy consumed by this sector at the national level has increased by only 3% in 13 years, from 84 TWh in 2000 to 86 TWh in 2018, thanks to the constant improvement in the energy efficiency of vehicles.
In addition to population growth, the following socio-economic factors contributed to this increase:
- Gross Domestic Product Growth [→ Q9].
- Growth in the level of car ownership: Switzerland had an average of 543 passenger cars per 1000 inhabitants in 2018, up from 493 in 2000.
- The slight decrease in the car occupancy rate: 1.56 occupying the average today, compared to 1.6 in 2000.
Road traffic now constitutes three-quarters of passenger transport in Switzerland (102 billion passenger-kilometres) and three-quarters of the sector’s final energy consumption. Rail covers 15% of our passenger transport needs (21 billion passenger-kilometres), but consumes only 4% of the sector’s final energy, demonstrating the 100% energy efficiency of the electrified railways. Conversely, air traffic consumes nearly 25% of the sector’s final energy for only 5% of the transport services provided (5 billion passenger-kilometres in 2014), reflecting the low energy efficiency of this mode of transport. despite an average aircraft seat occupancy rate of almost 80% worldwide.
Technological progress alone will not make it possible to control the evolution of consumption in the transport sector. Measures to moderate or even decrease the demand for mobility and transport will be necessary [→ Q37]. In this context, it should be noted that every Swiss person travels for an average of 1½ hours a day, of which about three-quarters of an hour is spent on leisure activities (tourism, restaurants, family, etc.), a quarter of an hour on shopping, a quarter of an hour on business trips, and ten minutes on standby. Measures to curb commuter mobility therefore affect only a small proportion of all daily journeys. The so-called “leisure society” and longer life expectancy, with its procession of fit senior citizens, represents new challenges for a possible moderation of mobility.
References
- Kemmler, Spillmann & Koziel (2018)
- Kemmler, A., Spillmann, T. & Koziel, S. (2018). Ex-post-analyse des schweizerischen energieverbrauchs 2000-2017 nach bestimmungsfaktoren. Office fédéral de l'énergie (OFEN).
- LITRA (Service d'information pour les transports publics) (2019)
- LITRA (Service d'information pour les transports publics) (2019). Les transports en chiffre - Edition 2019.
- Office fédéral de l'énergie (OFEN) (2019)
- Office fédéral de l'énergie (OFEN) (2019). Statistique globale de l’énergie 2018. OFEN.
- Office fédéral de la statistique (OFS) (2019)
- Office fédéral de la statistique (OFS) (2019). Energie: Panorama. OFS.
- Office fédéral de la statistique (OFS) (2019)
- Office fédéral de la statistique (OFS) (2019). Énergie: Consommation. [Online]. Available at: www.bfs.admin.ch/bfs/fr/home/statistiques/energie/consommation.html.
- Office fédéral de la statistique (OFS) (2019)
- Office fédéral de la statistique (OFS) (2019). Mobilité et transports - Statistique de poche 2019.
- Office fédéral de la statistique (OFS) (2019)
- Office fédéral de la statistique (OFS) (2019). Véhicules routiers - parc, taux de motorisation. [Online]. Available at: www.bfs.admin.ch/bfs/fr/home/statistiques/mobilite-transports/infrastructures-transport-vehicules/vehicules/vehicules-routiers-parc-taux-motorisation.html.
- Office fédéral de la statistique (OFS) (2019)
- Office fédéral de la statistique (OFS) (2019). Population. [Online]. Available at: www.bfs.admin.ch/bfs/fr/home/statistiques/population.html.